The promise of unlocking business potential through data analytics and platforms like Tableau is creating waves across many industries.
These methodologies and tools are incredibly valuable but I’d argue that gaining value from information starts with breaking down organisational barriers and building trust between the different business units.
Build an appetite for data
No new product in and of itself will transform a business. There are other, more fundamental processes and behaviours that, once set up, have significant influence over the effectiveness of your data analytics environment.
In the past 18 months, for example, we’ve gone from a company with low adoption of data analytics to a place where one in three employees now has access to valuable information from within our data analytics platform.
Break down data siloes
Transurban is like most organisations in that we have a myriad of siloed systems that are designed to perform their own specific function. From our operation and maintenance control systems (OMCS) that provides roadside incident information to sensors embedded underneath our roads, all of these systems are designed to perform their own unique task.
Sometimes it’s only when data from these individual systems is combined that we can gain valuable insights.
Solve real business problems
Understanding and combining all of this siloed data is critical, but it’s a pointless task if you don’t have real business problems to solve.
This introduces the most important aspect of building a sustainable and effective data analytics environment: business engagement.
Data analytics is overwhelmingly more effective in a symbiotic environment. Which is why we actively work to break down the ‘IT versus business’ mentality in order to create a culture that promotes honest and robust discussion.
We’re lucky that our colleagues from across the business have a strong appetite for data. This makes it easy to identify early adopters who have pressing business problems to solve. It’s important for technology to support these early adopters and to educate the rest of the business in becoming more data literate.
Over the last 18 months we have made huge progress by introducing technologies that make it much simpler to consume data but, more importantly, we’ve been working hard to embed a culture of data literacy within the whole organisation.
Cross-silo data analytics in action
One great example in which our data analytics platform has provided valuable insights is when we look at incidents on our roads and then use the massive amounts of data from our roadside sensors to understand the impacts these incidents have on traffic.
The map below shows a number of different roadside incidents on a specific day. We use a few visualisation techniques to highlight information that is particularly important, such as:
- bubble colour that is used to identify the type of roadside incident
- bubble size that is used to show the clearance time of the incident
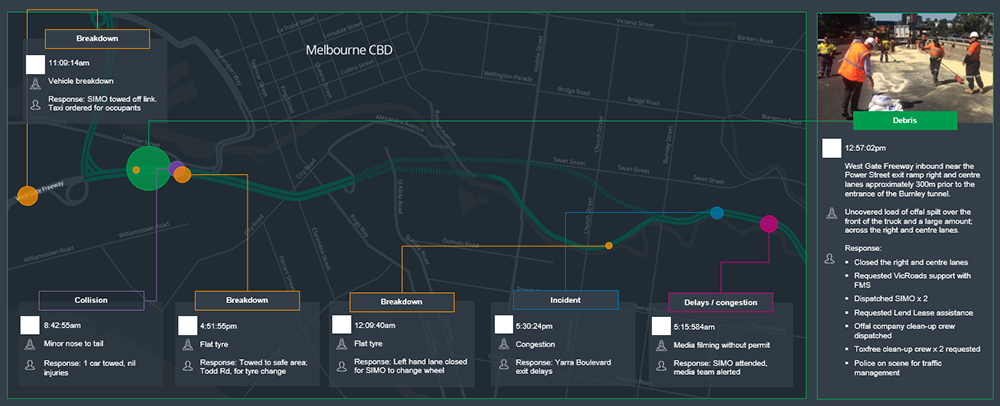
We then correlate each incident with roadside traffic data that is captured in 30-second increments from sensors embedded within the road.
Let’s focus on the incident depicted by large green bubble in the map above.
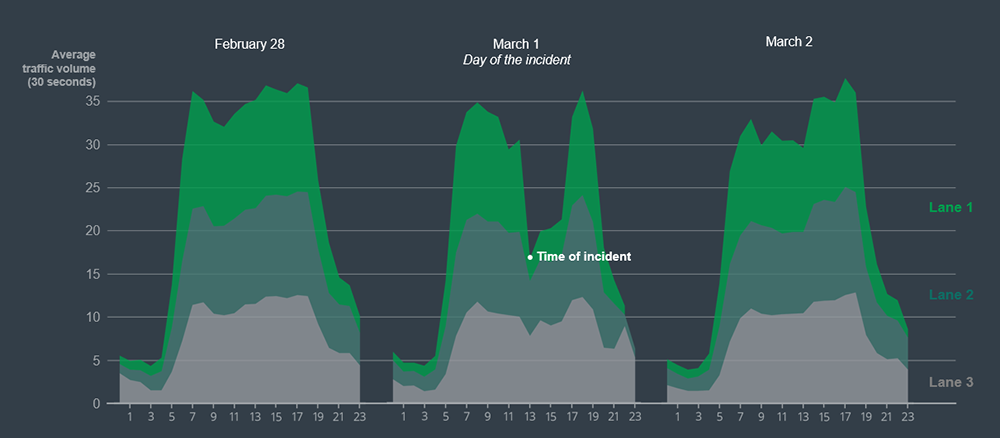
The visualisation below looks at traffic data across three days, and the green-bubble incident took place in the middle day (1 March). You can see just how significant that incident was by the impact it had on traffic volume on this day.
Keep the momentum going
Setting up a successful analytics environment is just the start. It is also important to establish programs that ensure data analytics remains relevant and sustainable. For us that means maintaining strong relationships between business units and creating a data analytics community of practice for knowledge sharing.
Data is no longer the sole domain of Technology and, at Transurban, we’re making giant strides to make governed data available to those that need it – which is very exciting.